|
|
|
|
|
|
|
|
|
|
|
|
|
|
|
|
|
|
Paper [arXiv] |
Cite [BibTeX] |


This figure demonstrates the length of the adaptive horizon of MPDP. The solid lines denote the average horizon length evaluated on each training batch. As the interactions accumulate, the model generalizes better and our method rapidly adapts to longer horizons.

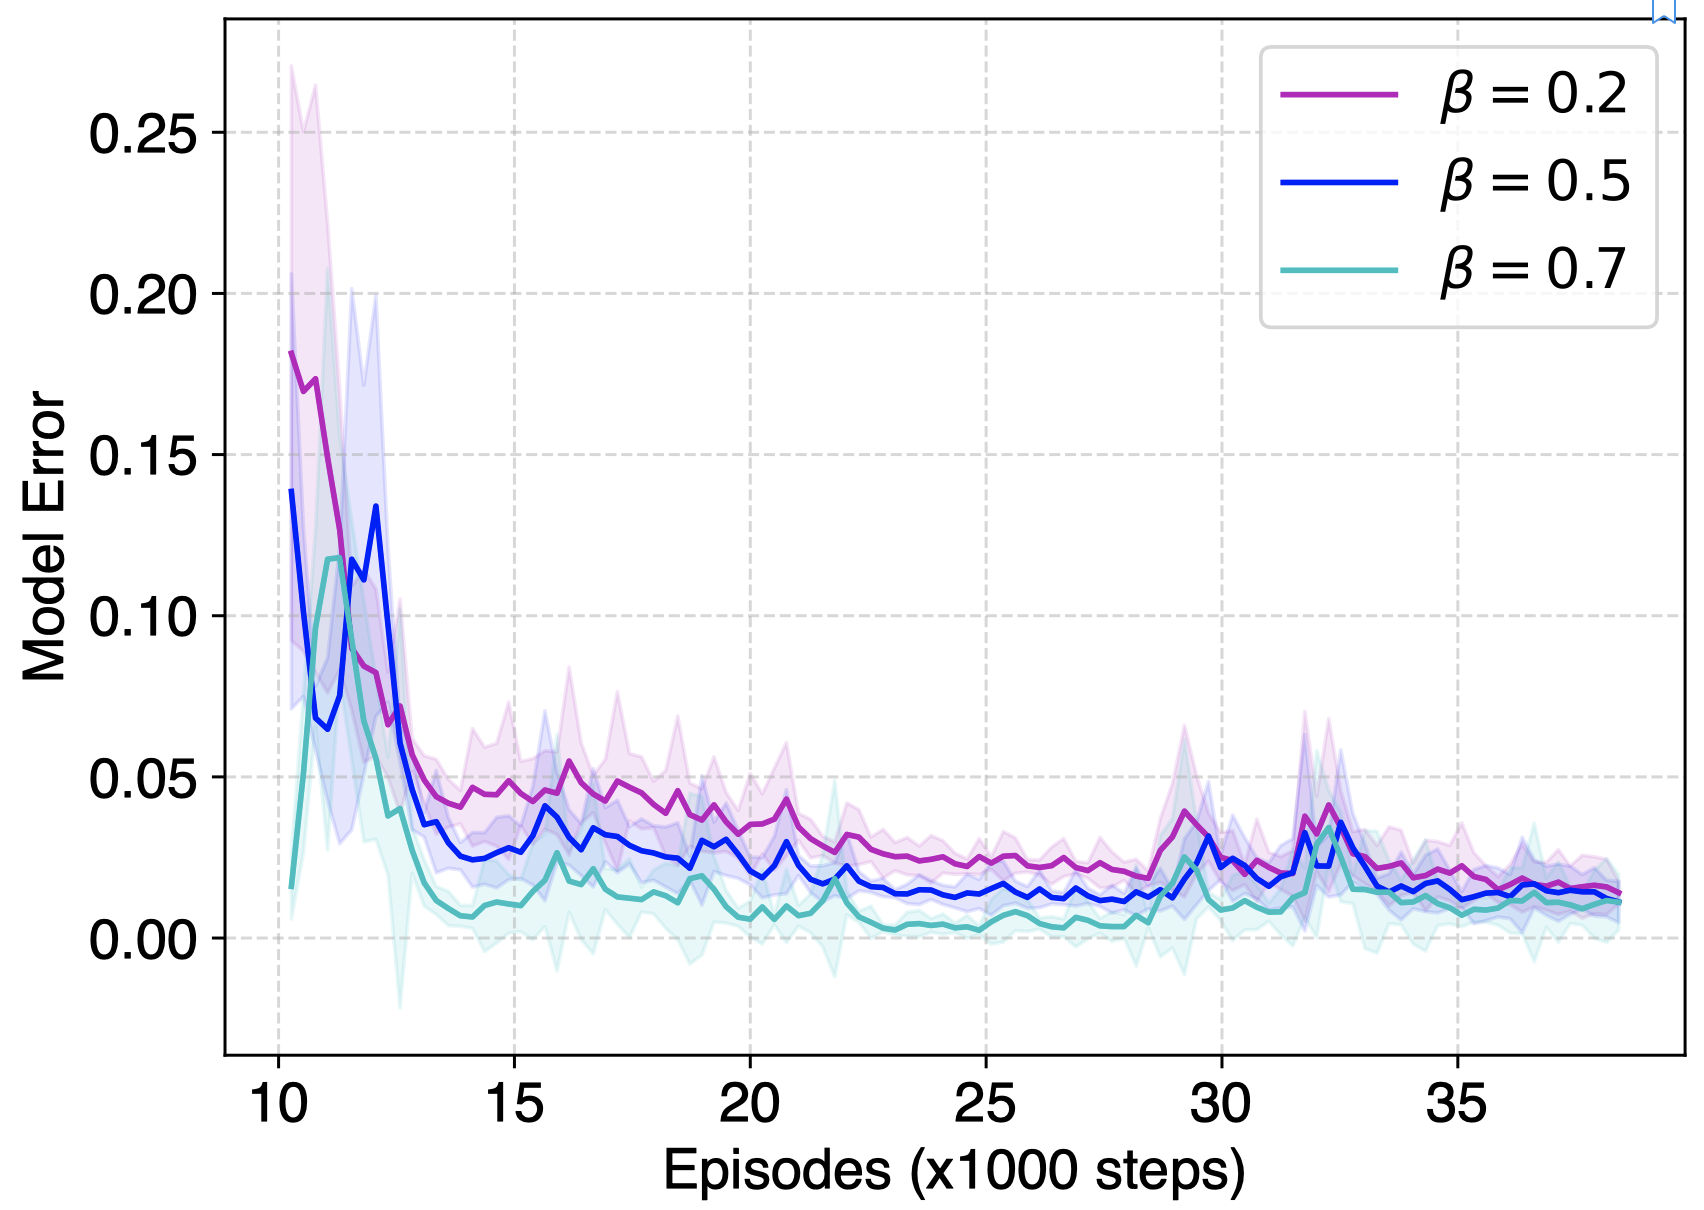
This figure shows the model error curves of MPDP with β varying from 0.2 to 0.7, measured by the average L2 norm of the predicted states on every 250 interactions. The model error decreases with β, which verifies that optimizing under our regularization effectively restricts behavior policy in the areas with low model error.

This figure shows the performance of MPDP with β varying from 0.2 to 0.7 along with MBPO on the Hopper task, evaluated over 4 trials. As β increases, the performance increases at first then decreases due to too strong restriction on the exploration. It also reveals that a larger regularization achieves more robust results.
                @inproceedings{li2023mpdp,
                    author = {Chuming Li, Ruonan Jia, Jie Liu, Yinmin Zhang, Yazhe Niu, Yaodong Yang, Yu Liu, Wanli Ouyang},
                    title = {Theoretically Guaranteed Policy Improvement Distilled from Model-Based Planning},
                    journal = {arXiv:2307.12933},
                    year = {2023}
                }
Based on a template by Phillip Isola and Richard Zhang.